Applied Work — Koch Company / GP Monticello, 2024
Embracing the Mill as a Complex Adaptive Ecosystem
A real-world application of Wardley Mapping and Cynefin to a Koch Company operation — diagnosing $4.94M in annual losses and identifying a $1.23M annual savings opportunity.
The Framework
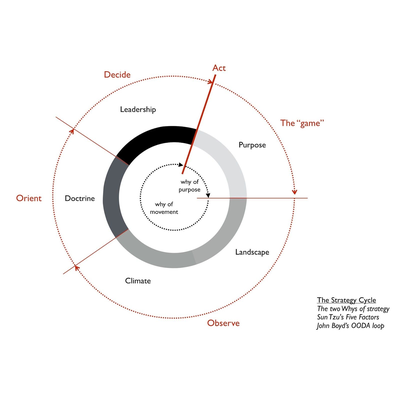
Observe. Orient. Decide. Act.
Every analysis begins here. The Strategy Cycle — Boyd's OODA loop, Sun Tzu's Five Factors, the two Whys of strategy — is the framework that precedes the map. Before a single component is placed on a Wardley Map, the situation must be developed. The GP Monticello analysis is this cycle applied to a real industrial operation.
The same tools that map an athlete's career can map a paper mill's operational landscape.
In 2024, this analysis applied Simon Wardley's mapping method and Dave Snowden's complex adaptive systems thinking to a Koch Company paper mill operation — GP Monticello. The question was simple: where is value being lost, and why can't the organisation see it?
Thomas Sowell's insight from Knowledge and Decisions was the starting point: the people closest to the problem — the mill operators — held knowledge that was not reaching the decision-makers. The map made that gap visible.
This is the same capability a student-athlete builds when they map an organisation. The domain changes. The method does not.
Making the invisible visible.
The Wardley Map places every component of the mill's operational landscape on two axes: visibility to the user (vertical) and evolutionary stage (horizontal). The result reveals where the organisation is operating on inertia — and where the leverage actually is.
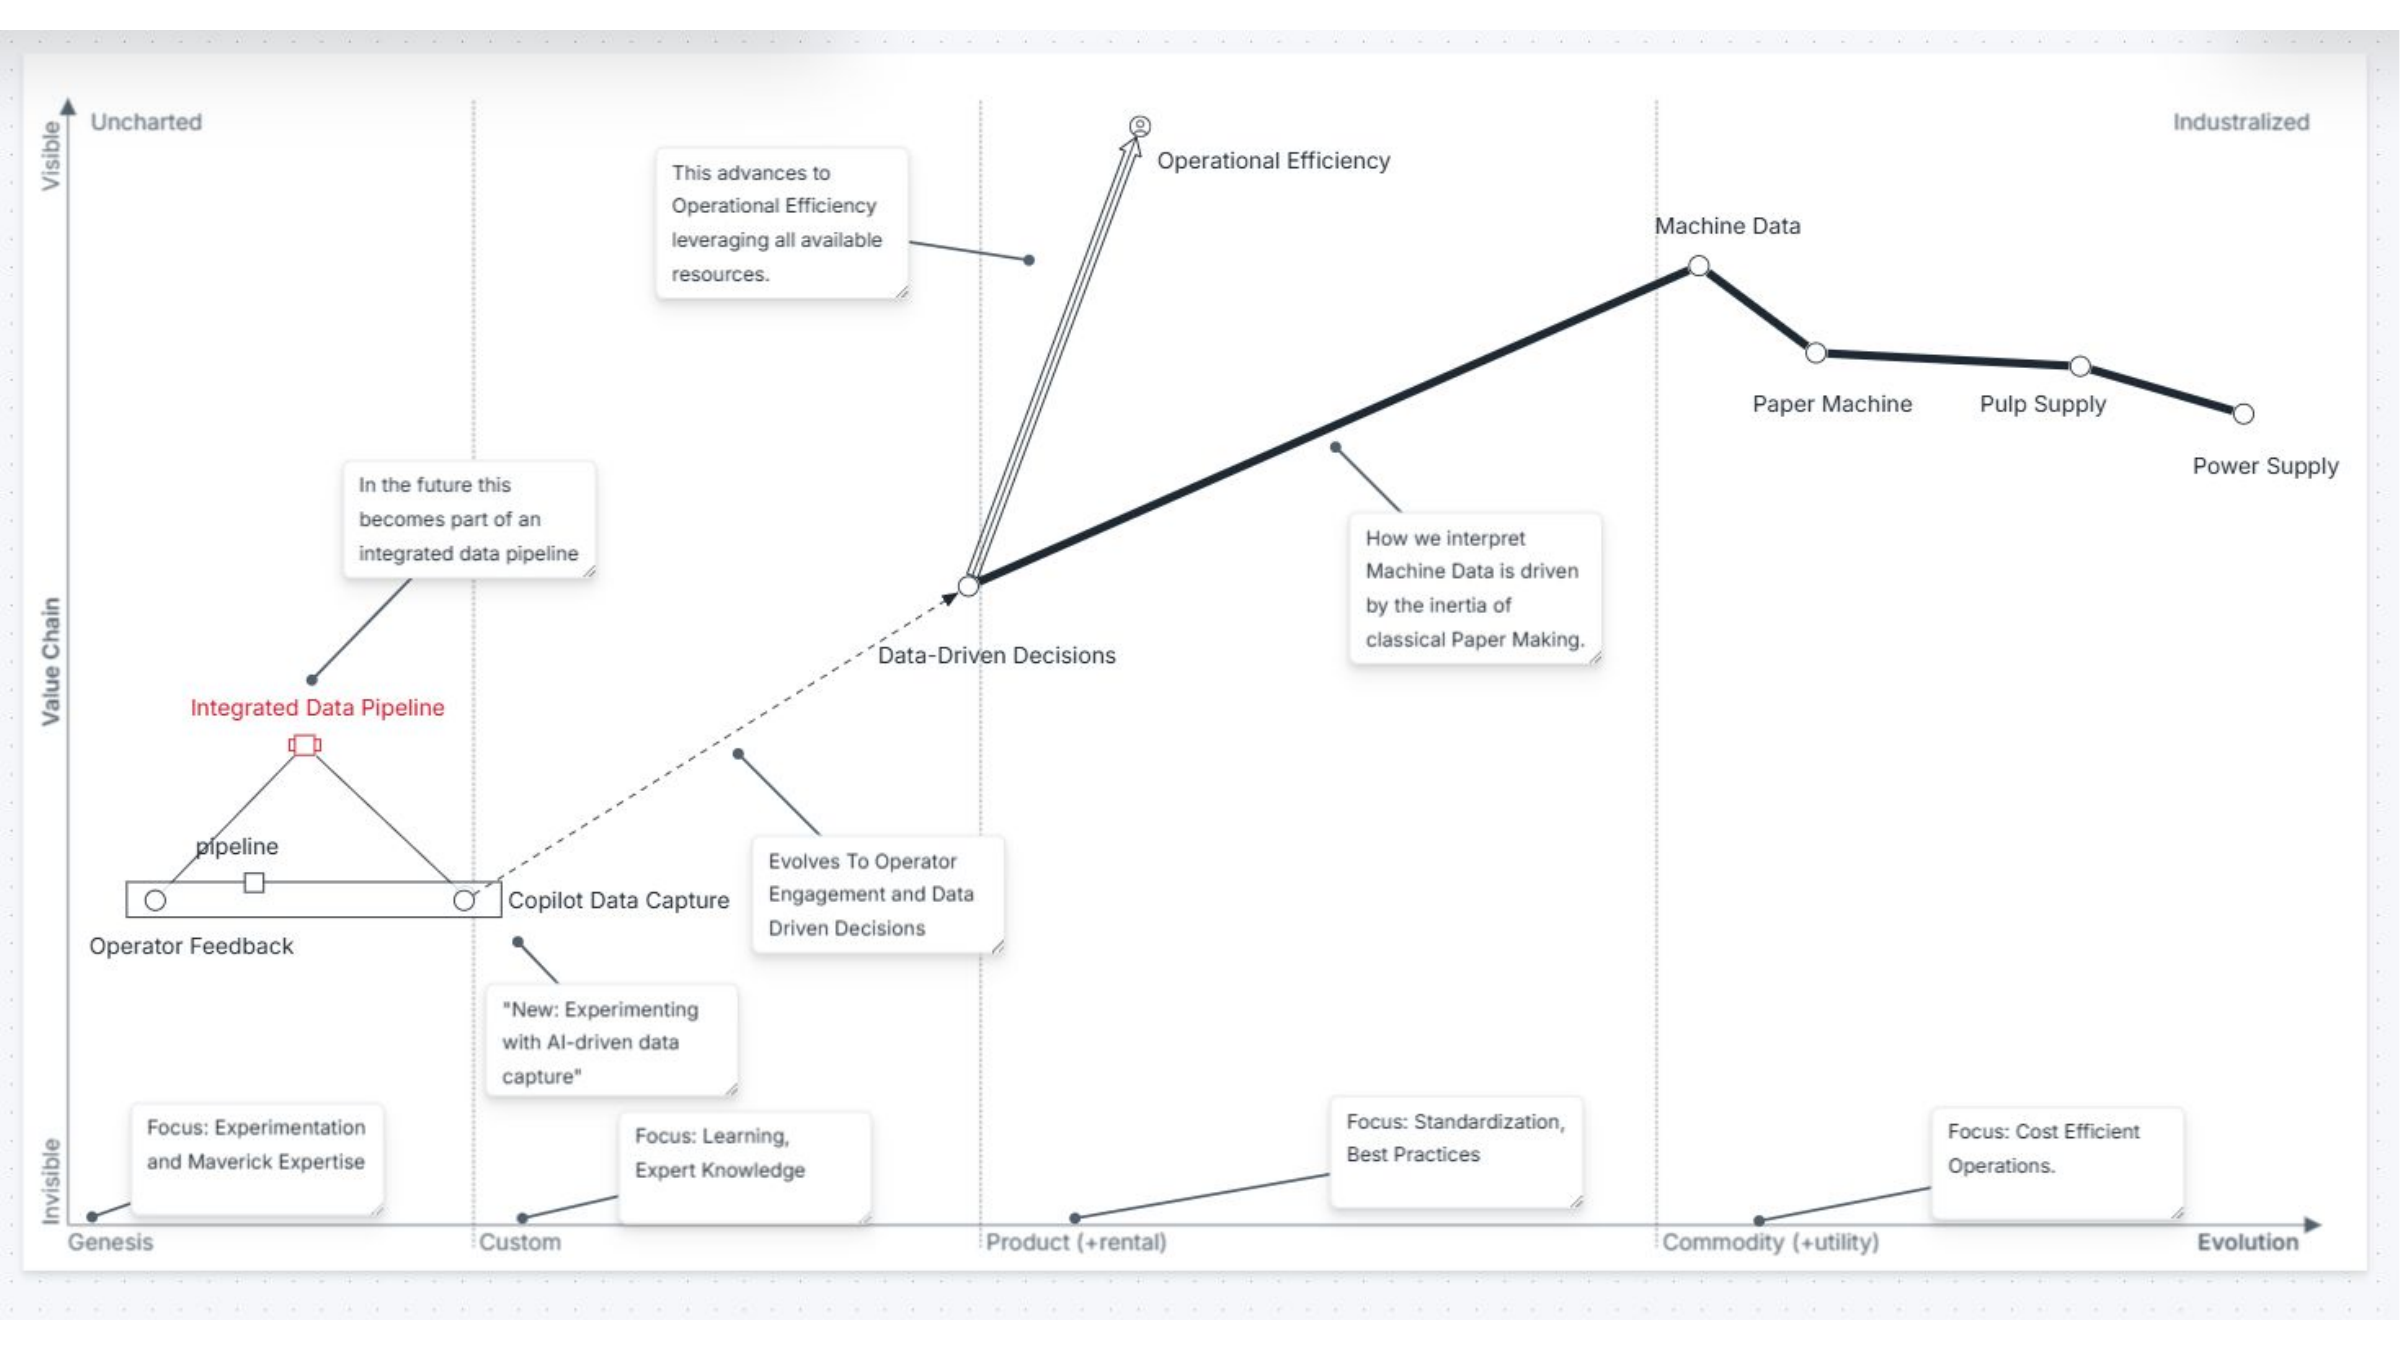
Anchor
Operational Efficiency — the user need that everything else must serve. Visible, urgent, and currently unrealised.
The Strategic Gap
Integrated Data Pipeline and Copilot Data Capture sit at Genesis — experimental, AI-driven, not yet connected. This is where the leverage is.
The Inertia
Machine Data interpretation is driven by the inertia of classical paper-making. The data exists; the organisation's mental model does not yet use it.
The map told us where to look. The data told us what it cost.
Clothing category downtime analysis for Koch Company / GP Monticello, 2024. The Tableau dashboard quantified what the Wardley Map had already identified as the operational gap.
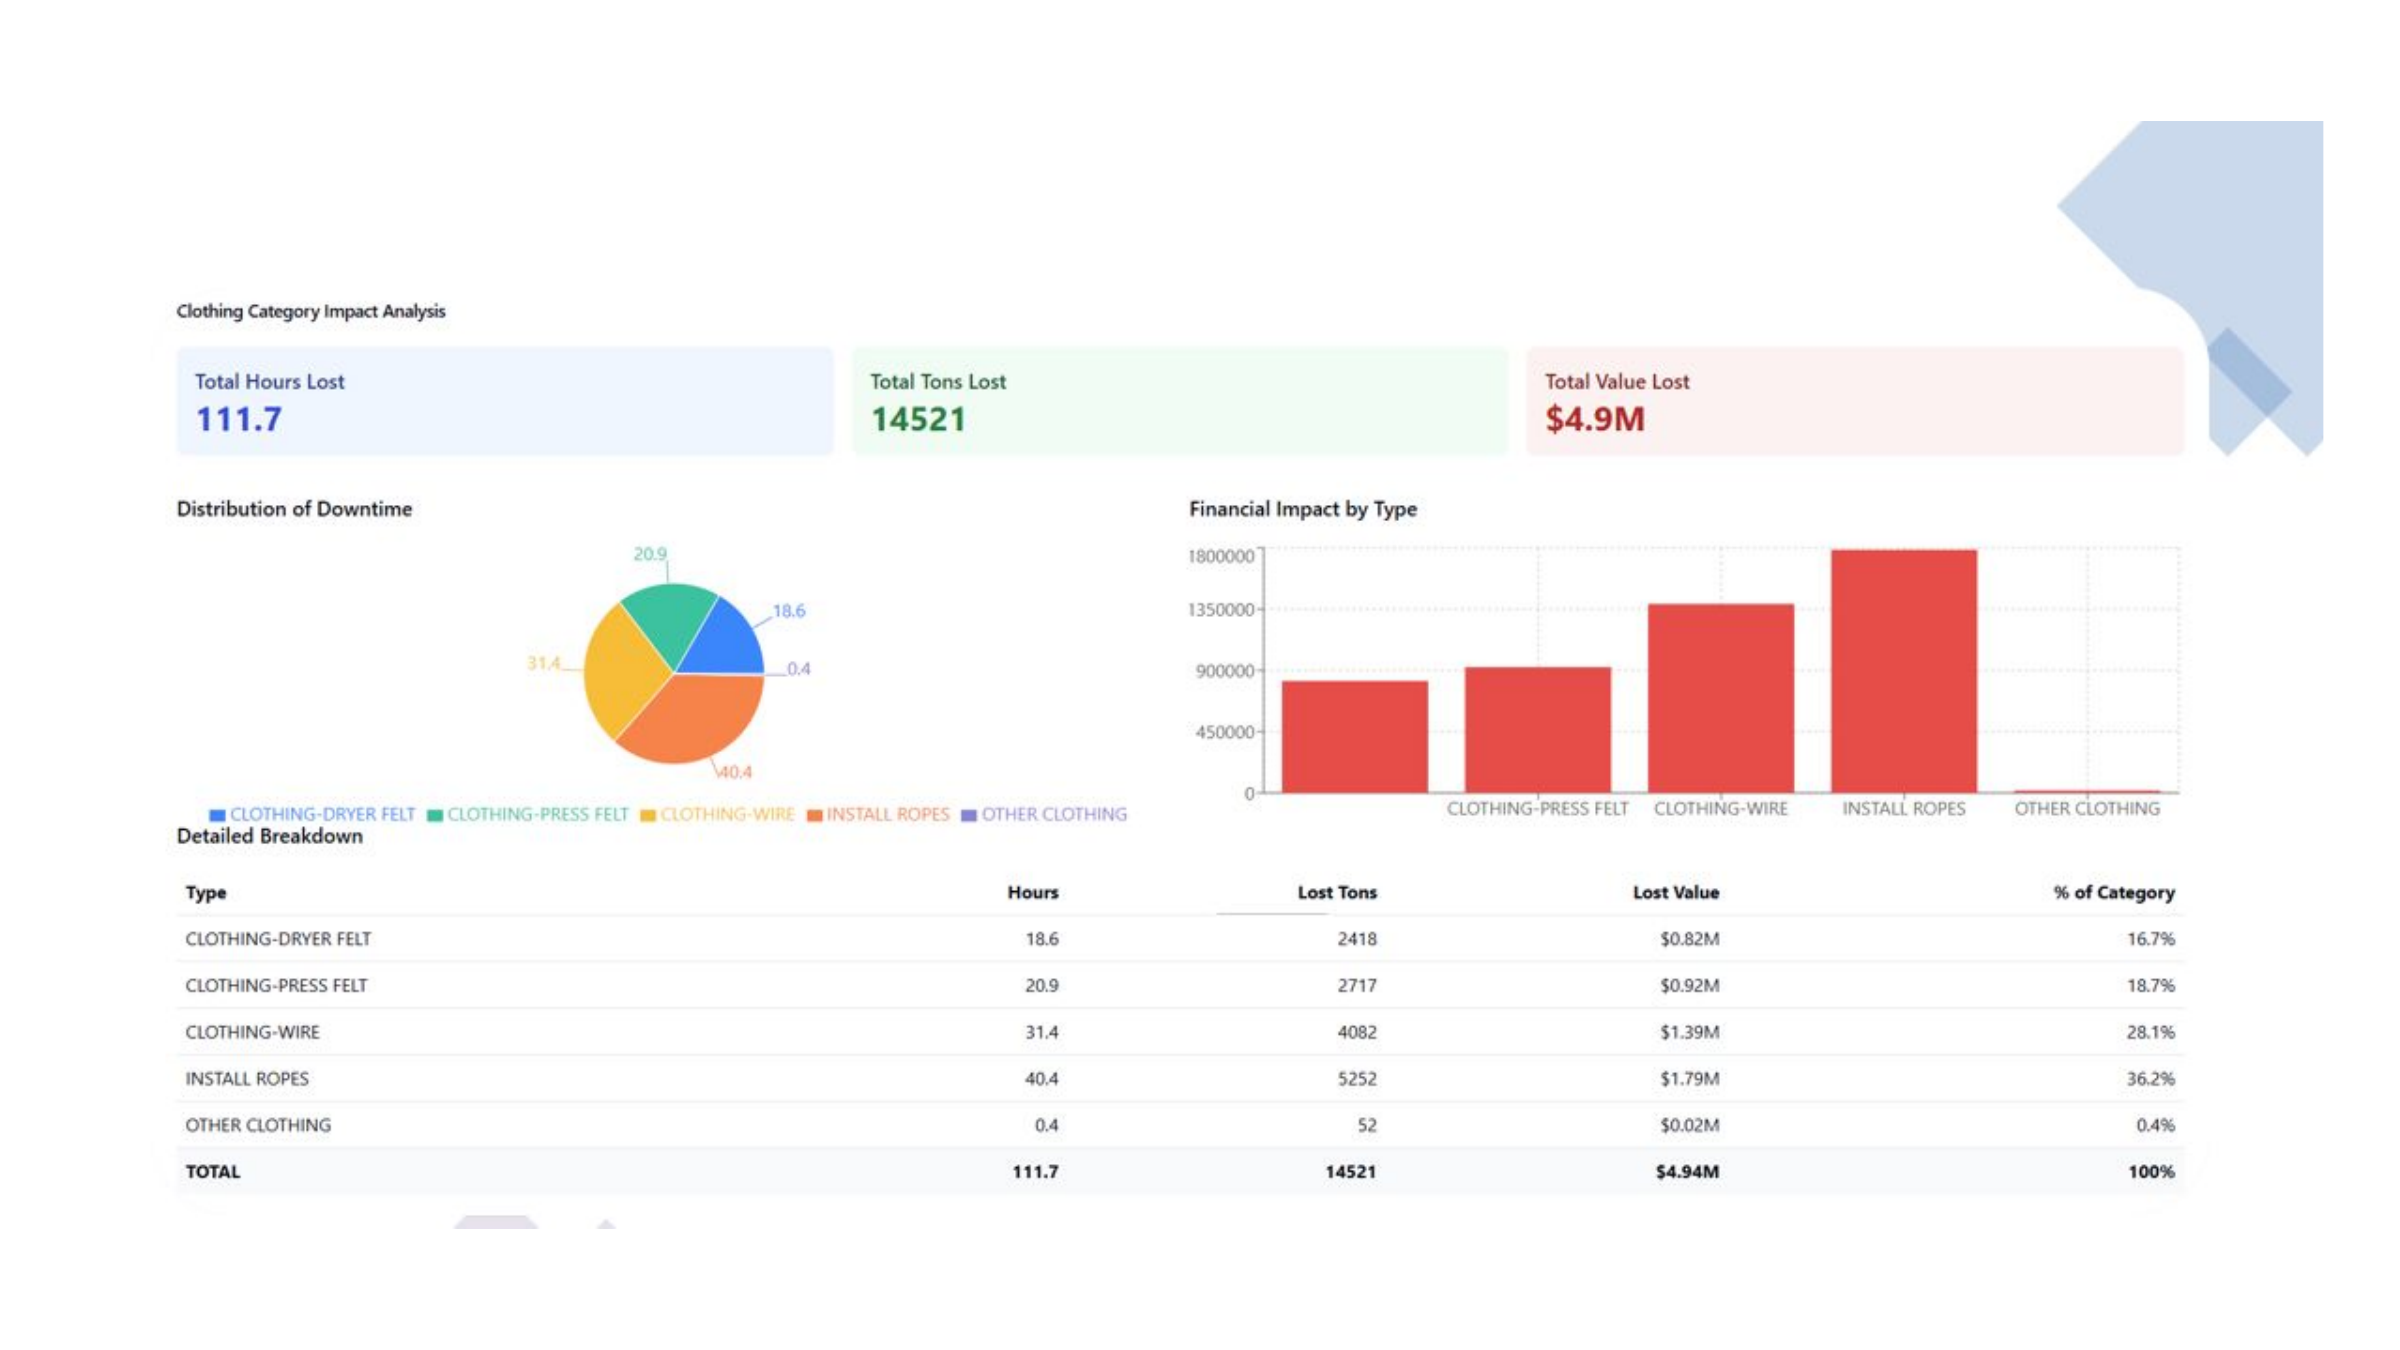
The map reveals where to act. The data confirms the priority.
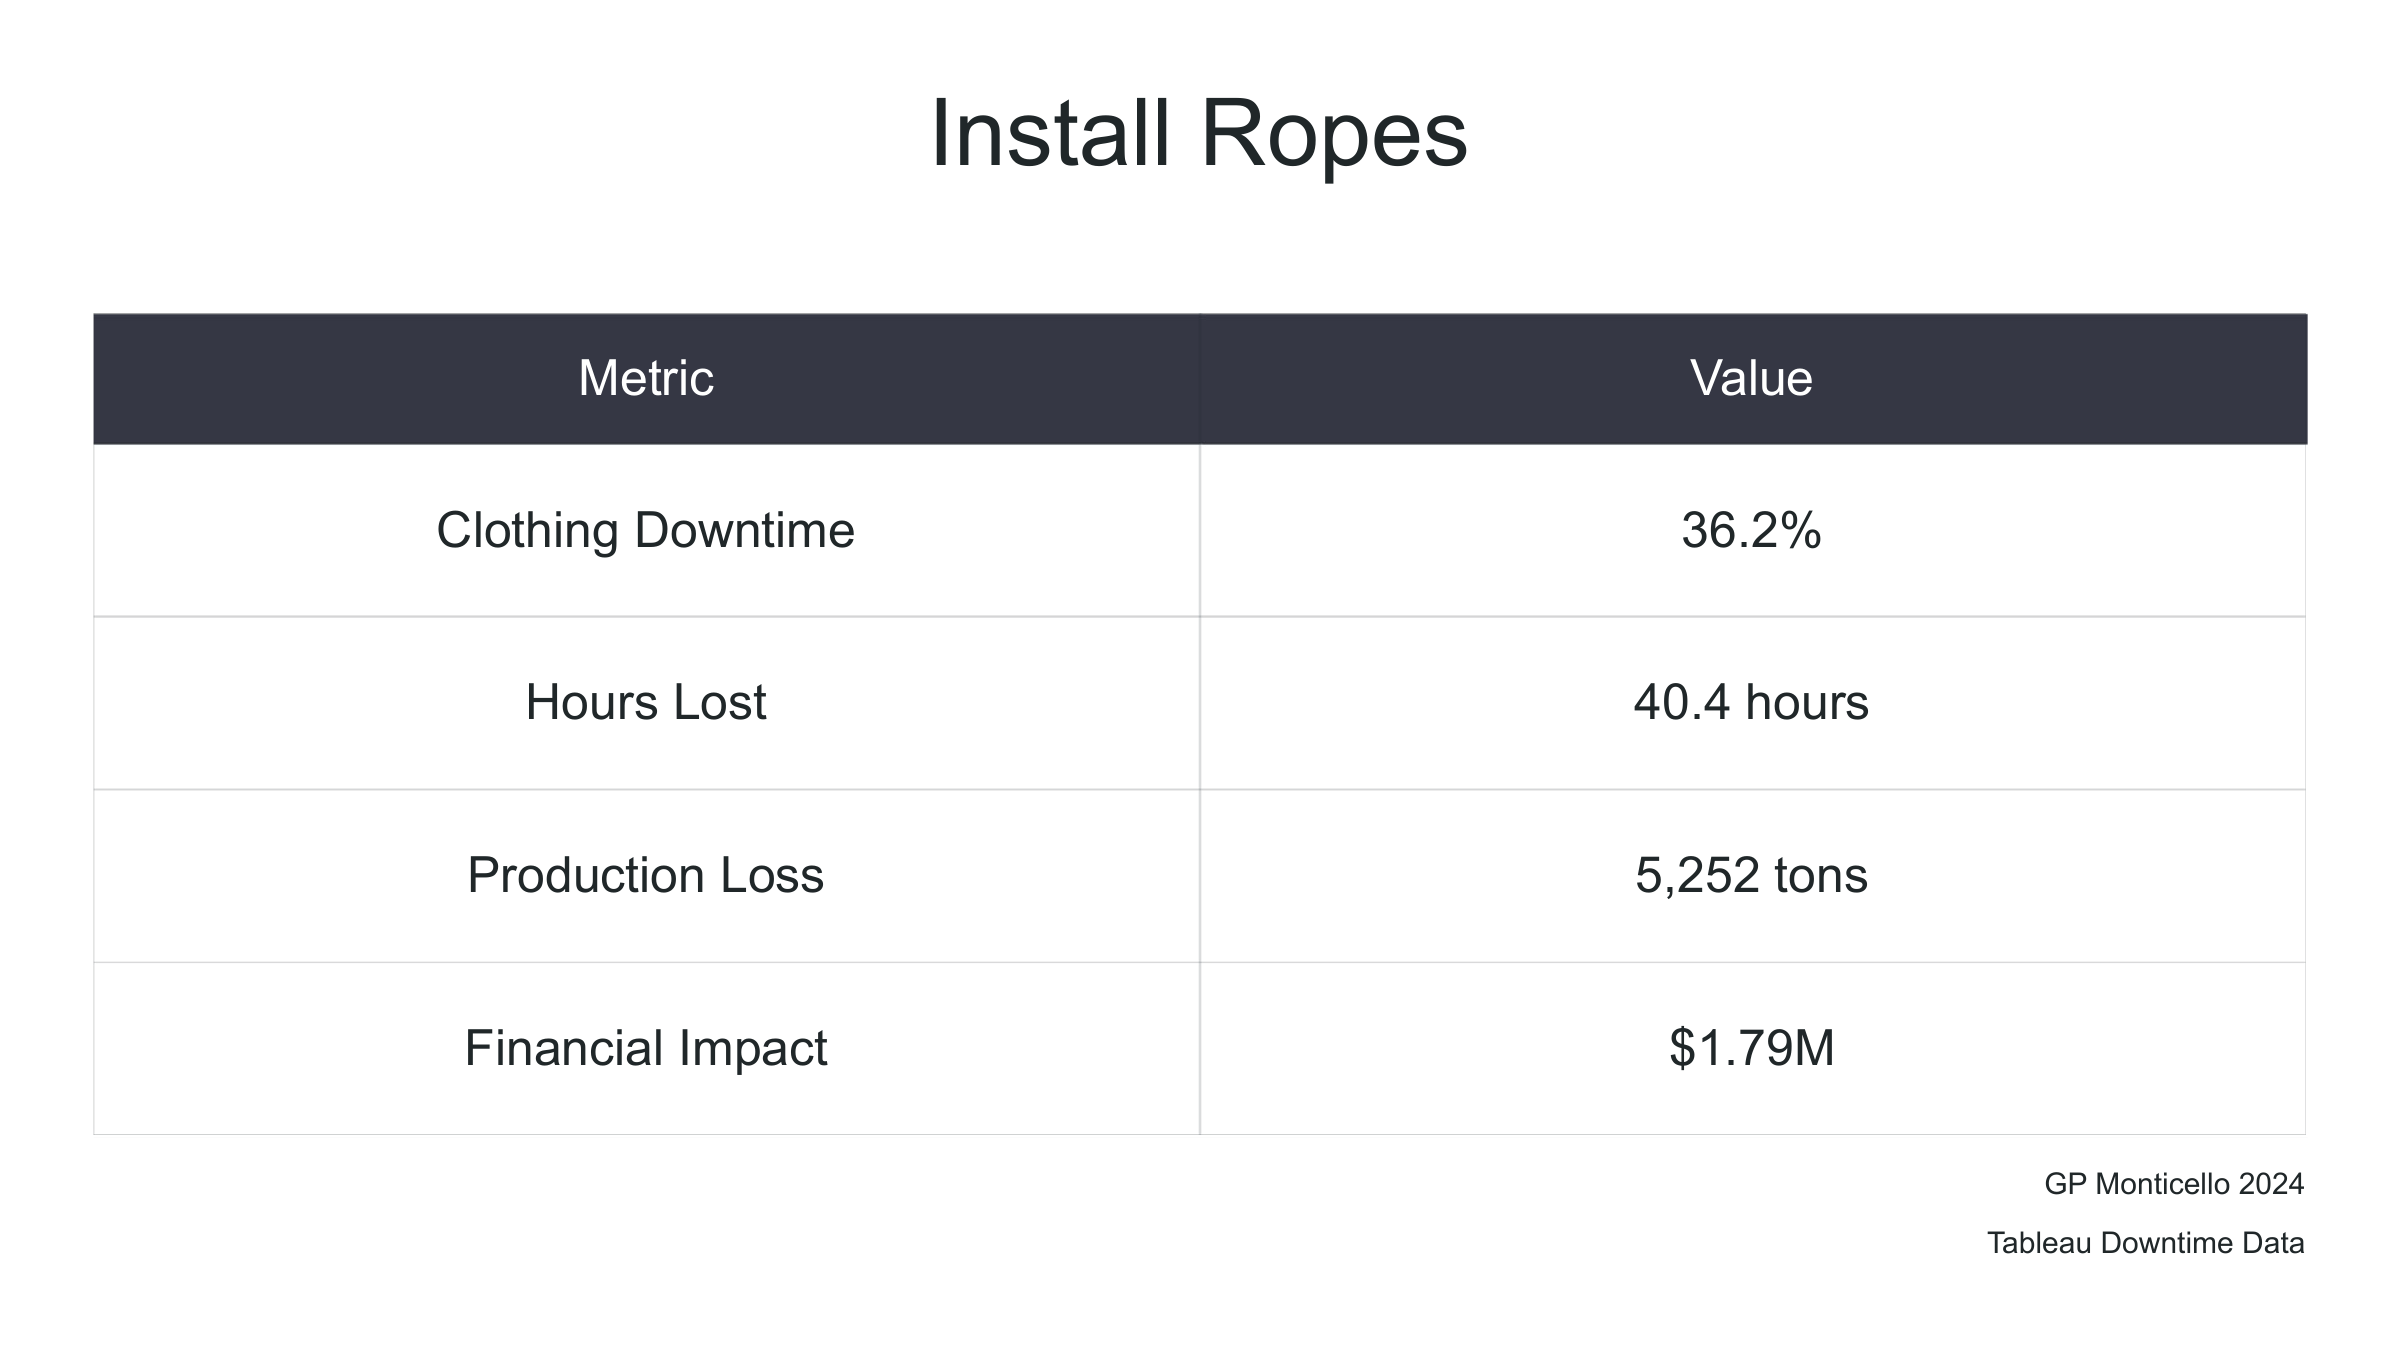
Install Ropes was the single largest contributor to clothing downtime — 36.2% of the category, 40.4 hours lost, 5,252 tons of production, $1.79M in annual financial impact.
This is not a finding that required a consultant. It required situational awareness — the ability to read the landscape, identify what was invisible, and connect the operational data to the strategic map.
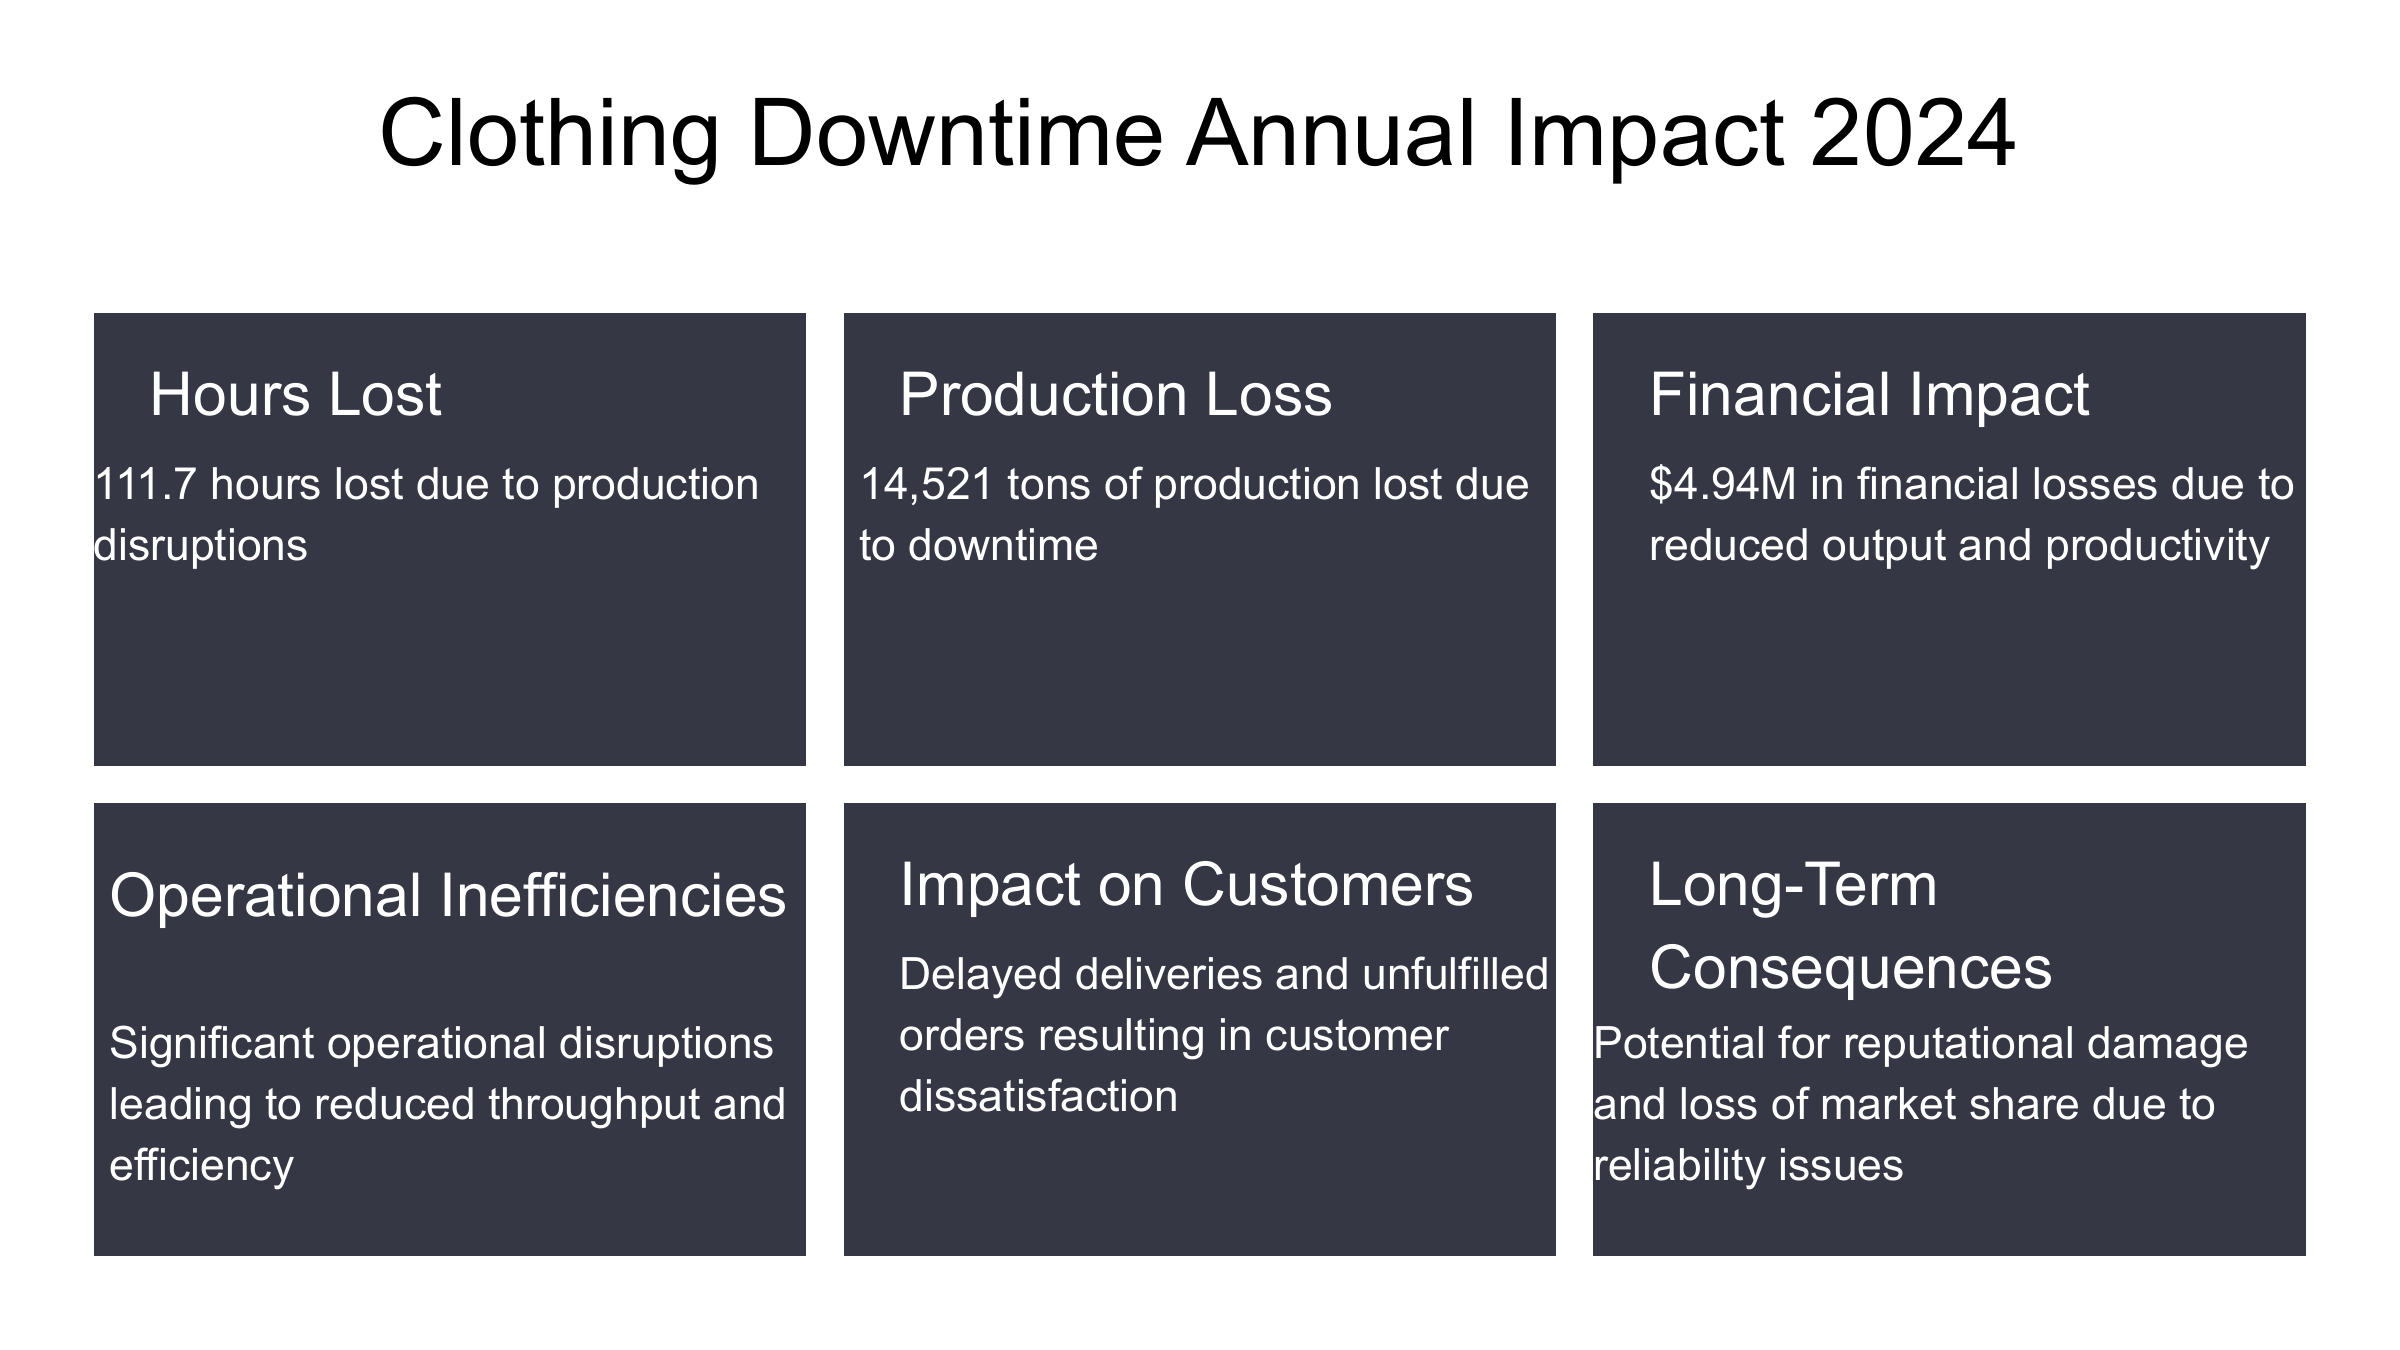
A 25% improvement. $1.23M saved. 3,617 tons recovered.
The conservative scenario — a 25% improvement in Install Ropes downtime — produces 27.8 hours saved per year, $1.23 million in annual cost savings, and 3,617 tons of materials recovered, reducing waste and increasing sustainability.
This is what demonstrated work experience looks like. Not a résumé line. Not a belief. A map, a dataset, and a measurable outcome.
The Lesson for Athletes
"The domain was a paper mill. The method was the same one you will use to map any organisation you want to work for. The tools do not care what industry you are in."
Sowell gave the language for why the operators' knowledge was not reaching the decision-makers. Snowden gave the framework for understanding why the system behaved the way it did. Wardley gave the map that made it all visible. The result was a $1.23M annual savings opportunity — found not by a consultant, but by reading the landscape.
Start Mapping Now ↗